Analysis
An overview of the initial traffic analysis undertaken.
Baseline
- As there have been changes in traffic flows on Lambeth’s roads between when historic data was collected and this monitoring programme (most significantly due to COVID-19, but also resulting from seasonal shifts in travel patterns – as can be seen in the chart below), a direct comparison between historical and current data to understand the impact of the LTN would be inaccurate.
- To factor in these differences, a baseline flow has been calculated for each ATC based on the difference between current background data and historic background data, both of which come from TfL-owned ATCs which have collected continuous data since at least January 2017. A worked example is provided in the Independent Monitoring Study and appendices.
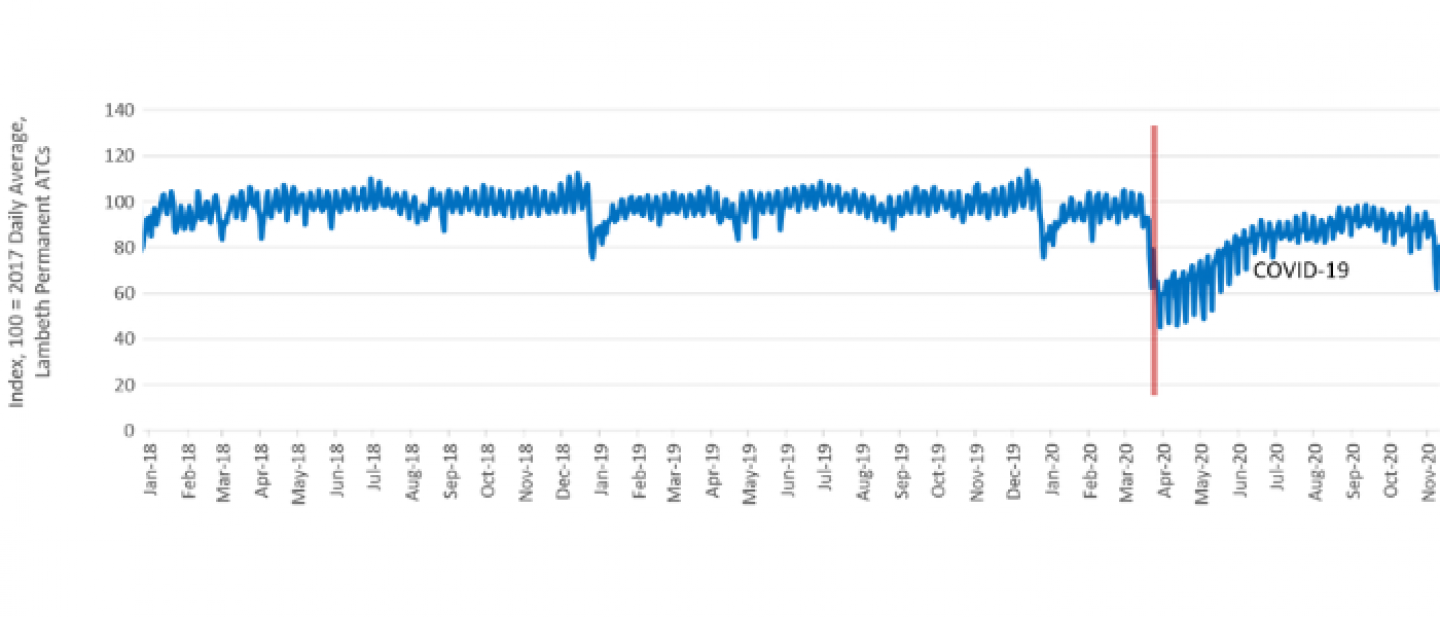
Graph: Transport for London continuous traffic monitoring showing the average volume of traffic recorded at all ATC sites across the borough from January 2018 to November 2020. Download an image of the full chart with data back to 2017.
Streatham Hill LTN ATC Sites
For the Streatham Hill LTN a total of 11 ATCs were installed from 19th October – 25th October. These can be seen in the map on this page.
- Of these, 9 were inside the boundary of the LTN, with 2 on key peripheral roads– these, combined with 2 TfL permanent ATCs on Streatham Hill & Christchurch Road can provide insight into spillover effects from the LTN.
- For Streatham Hill LTN, 1 site uses Healthy Routes as a baseline, 5 sites use the 20mph study and 3 utilise both The Floow data and Healthy Routes. The remaining 2 sites use data from studies specific to the area.
- Data has not been collected during school holidays and have been adjusted to COVID-19 and seasonal shifts in travel patterns

Image: a map of the Streatham Hill LTN showing the traffic count and filter locations within and on the periphery of the LTN.
Trends
General Trends
The following overall percentage changes in counts were observed when comparing traffic counts in September 2020 against the baseline.
- Within the LTN, the following overall percentage changes in counts were observed against the baseline:
- car: -25%
- cycle: +117%
- goods vehicles: -10%
- On the periphery of the LTN, the following overall percentage changes in counts were observed against the baseline:
- car: +44%
- cycle: +167%
- goods vehicles: +19%
- Across both internal and peripheral roads*, the following overall percentage changes in counts were as follows:
- car: +8%
- cycle: +135%
- goods Vehicle: +5%
Note: Transport for London sites on Christchurch Road and Streatham Hill are not included in the above calculations due to a larger margin of error and therefore outsized impact on calculation results. Please see Appendix B for further detail.

Image: a map of the Streatham Hill LTN showing the general change in traffic volumes within and on the periphery of the LTN.
Specific Trends
- Inside most of the LTN, there was a general decrease in both cars and goods vehicles when compared with the baseline. However, motor vehicle flows have increased in the southern section. Particularly, on roads which provide a route between Leigham Court Road and Leigham Vale, for example around Mt. Nod Road. Qualitative analysis of feedback supports this.
- Traffic analysis shows an increase in traffic counts along the eastern portion of Palace Road; although this is not represented in qualitative feedback.
- Motor vehicle flows have increased on both of the peripheral roads monitored.
- Cycle flows recorded a large increase, both inside the LTN and on peripheral roads; however, this increase is from a very small predicted baseline.

Image: a map of the Streatham Hill LTN showing the way that traffic has changed on various roads through the area.