Analysis
An overview of initial traffic analysis undertaken.
Baseline
- As there have been changes in traffic flows on Lambeth’s roads between when historic data was collected and this monitoring programme (most significantly due to COVID-19, but also resulting from seasonal shifts in travel patterns – as can be seen in the chart below), a direct comparison between historical and current data to understand the impact of the LTN would be inaccurate.
- To factor in these differences, baseline traffic volumes have been calculated for each traffic count location based on the difference between current background data and historic background data, both of which come from TfL-owned traffic counts which have collected continuous data since the first baseline count data was collected in January 2017. A worked example of this baseline calculation is provided in the Independent Monitoring Study and appendices.
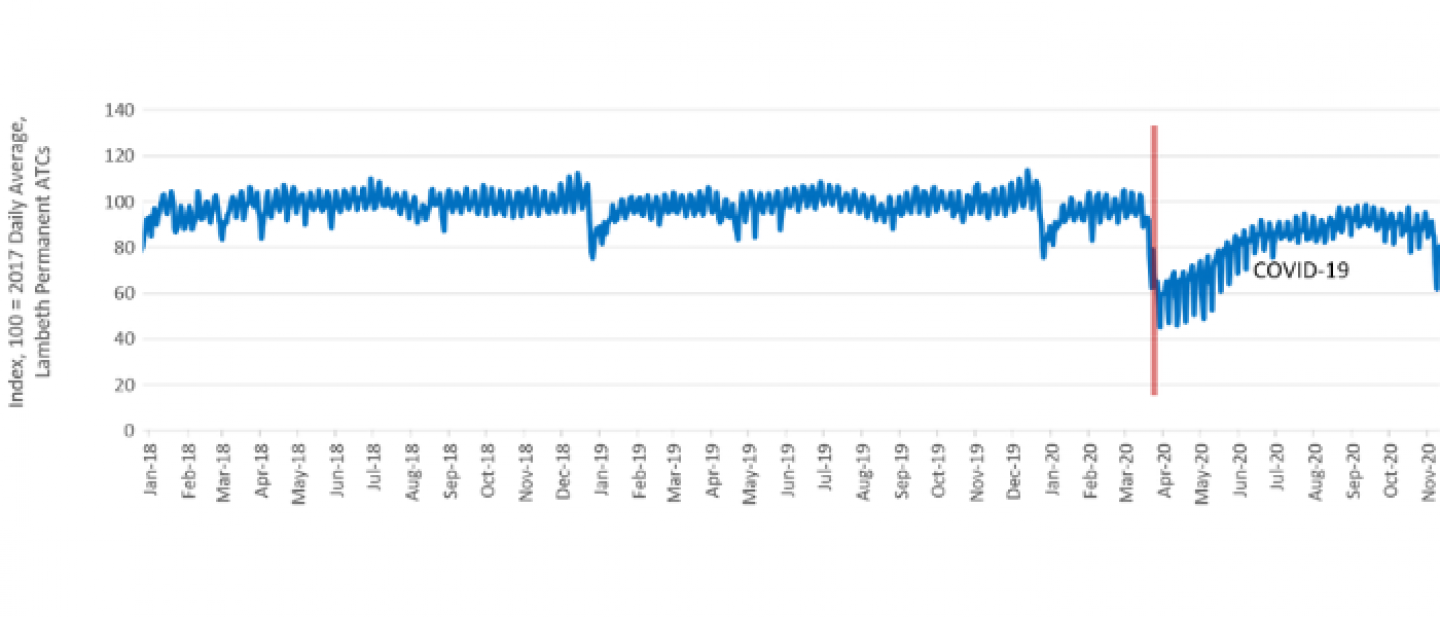
Graph: Transport for London continuous traffic monitoring showing the average volume of traffic recorded at all ATC sites across the borough from January 2018 to November 2020. Download an image of the full chart with data back to 2017.
Ferndale LTN ATC sites
- For the Ferndale LTN, a total of 11 ATCs were installed from 19th October to 25th October. These can be seen in the map below.
- Of these, 7 were inside the boundary of the LTN, with the remaining 4 on peripheral roads to pick up any spillover effects from the LTN.
- 3 sites use Healthy Routes as a baseline, 4 sites use the 20mph study and 4 utilise both The Floow data and Healthy Routes.
- Data has not been collected during school holidays and has been adjusted to COVID-19 and seasonal shifts in travel patterns
- For stage 1, counts were not completed on Brixton Road or Stockwell Road. These will be completed at Stage 2.

Image: Summary map of the Ferndale stage 1 traffic monitoring locations from F1 to F11.
Trends
General Trends
- Within the LTN, the following overall percentage changes in counts were observed against the baseline:
- Car: -46%
- Cycle: +92%
- Goods vehicles: -33%
On the periphery of the LTN*, the following overall percentage changes in counts were observed against the baseline:
- Car: +23%
- Cycle: +52%
- Goods vehicles: +17%
Across both internal and peripheral roads, the following overall percentage changes in counts were as follows:
- Car: +4%
- Cycle: +69%
- Goods Vehicle: +5%
*Note that for this stage of monitoring, traffic data was not collected on boundary roads managed by Transport for London. This means data is not included for Brixton Road and Stockwell Road in the above figures. The cumulative impacts of the LTN including all boundary roads will be assessed at stage 2.

Specific trends
- Within the LTN, car and goods vehicle flows are generally down, although have slightly increased on some roads with previously very low flows.
- Cycle flows are generally up throughout the LTN, except on Bernay’s Road.
- Car and goods vehicle flows have increased on Landor Road, with moderate increases on Bedford Road. The level of traffic increase on Landor Road is greater than the volume of traffic that was previously using routes through the LTN so this increase is likely the result of external factorsand will be monitored in greater detail at Stage 2.
- Traffic flows on Ferndale Road, east of Medwyn Road have reduced whilst volumes west of Tintern Street flows have increased.
- Details for individual sites are located in the Independent Traffic Analysis reports and appendices available.
Additional ad-hoc monitoring
- Additional ad-hoc traffic counts were conducted at the end of August 2020 to assess the immediate impacts of the Pulross Road filter across the LTN area.
- These counts highlighted an increase in flows on Combermere Road and Trinity Gardens, and Ferndale Road west.
- Not all of the ad-hoc sites were included in the Stage 1 monitoring, however this data has been used in conjunction with the Stage 1 counts to inform changes to the Low Traffic Neighbourhood.
- Specifically – this data highlighted the increase in traffic on Combermere Road for which additional measures are being introduced.