Using layers
Image

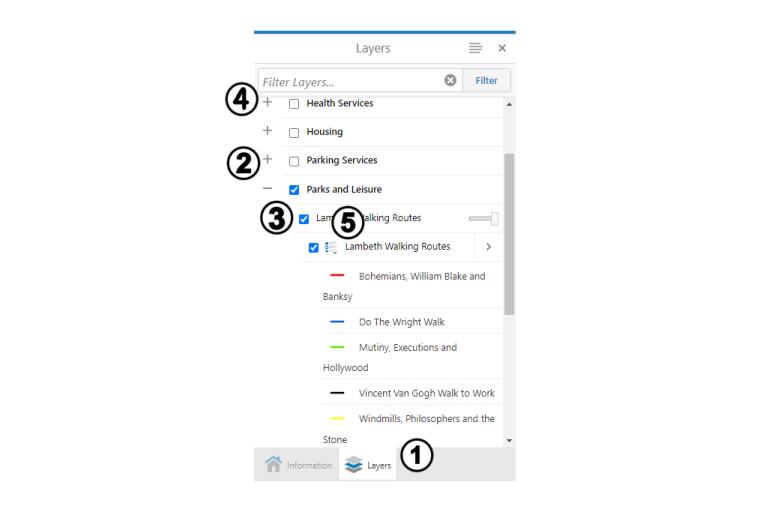
- The ‘Layers’ button shows you what layers of information are available.
- Use the + and - signs to open the menu further for each type of data, for example, ‘Parks and leisure’.
- Tick and untick the boxes next to each type of data to show or hide it on the map, for example, tick ‘Lambeth walking routes’ to see that data.
- Use the + sign to see the map symbol for that type of data.
- Use the symbol next to the data layer name to see if it has been divided into further categories.
