Analysis
An overview of initial traffic analysis undertaken.
Baseline
- As there have been changes in traffic flows on Lambeth’s roads between when historic data was collected and this monitoring programme (most significantly due to COVID-19, but also resulting from seasonal shifts in travel patterns – as can be seen in the chart below), a direct comparison between historical and current data to understand the impact of the LTN would be inaccurate.
- To factor in these differences, a baseline flow has been calculated for each ATC based on the difference between current background data and historic background data, both of which come from TfL-owned ATCs which have collected continuous data since at least January 2017. A worked example is provided in the Independent Monitoring Study and appendices.
Image
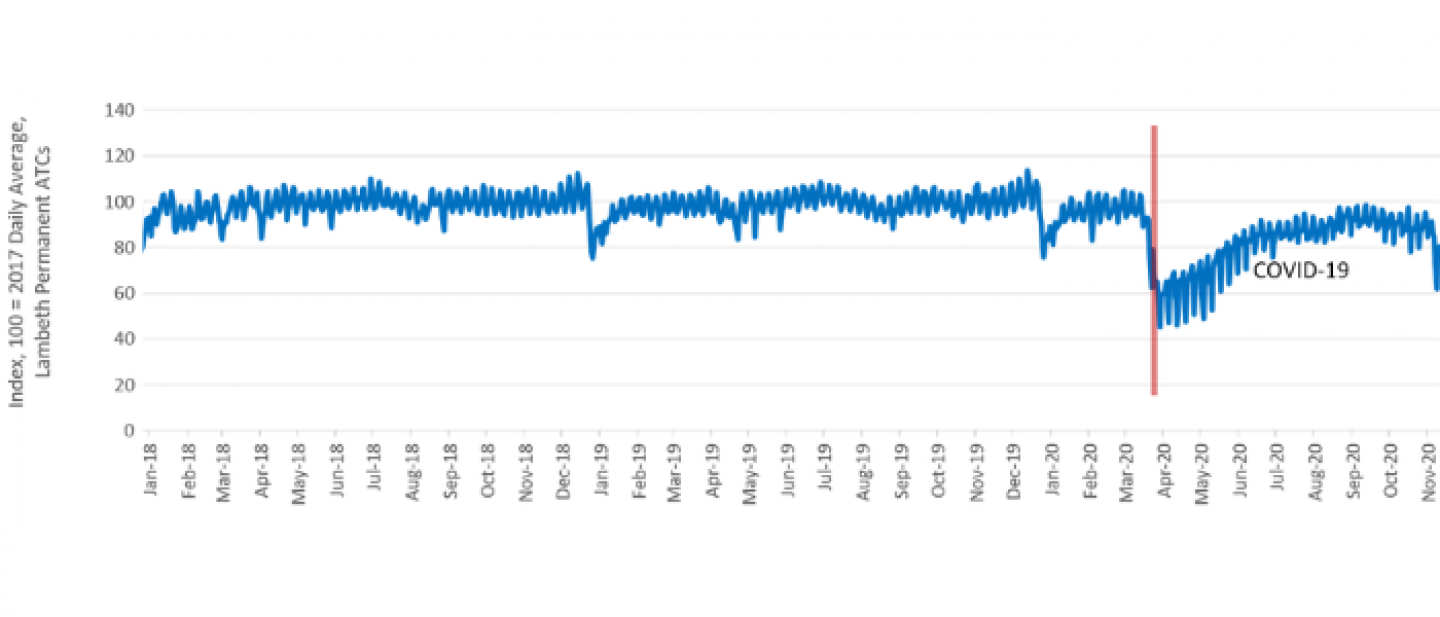
Graph: Transport for London continuous traffic monitoring showing the average volume of traffic recorded at all ATC sites across the borough from January 2018 to November 2020. Download an image of the full chart with data back to 2017.
Railton LTN ATC Sites
- For the Railton LTN, a total of 17 ATCs were installed from 21st September – 27th September. These can be seen in the map on this page.
- Of these, 10 were inside the boundary of the LTN, with the remaining 7 on peripheral roads to pick up any spillover effects from the LTN.
- For Railton LTN, 8 sites use Healthy Routes as a baseline, 6 sites use the 20mph study and 3 utilise both The Floow data and Healthy Routes.
- Data has not been collected during school holidays and has been adjusted to account for COVID-19 and seasonal shifts in travel patterns
Trends
General Trends
- Within the LTN, the following overall percentage changes in counts were observed against the baseline:
- Car: -58%
- Cycle: +51%
- Goods Vehicle: -43%
- On the periphery of the LTN, the following overall percentage changes in counts were observed against the baseline:
- Car: -11%
- Cycle: +31%
- Goods Vehicle: -6%
- Across both internal and peripheral roads, the following overall percentage changes in counts were as follows:
- Car: -24%
- Cycle: +40%
- Goods Vehicle: -17%
Specific Trends
- Along key routes such as Railton Road, car flows are down more than 75% and cycle flows up a similar percentage.
- Whilst on the periphery, car and goods vehicle volumes are generally also down, they have slightly increased in some locations (Coldharbour Lane, for example). Cycling has also generally increased on peripheral roads, although again with some exceptions (Effra Road).
- Rattray Road (in red) shows large percentage increases in vehicles in both directions
- Details for individual sites are located in the Independent Monitoring Study and appendices.
Image

Image: a map of the Railton area showing the way that traffic has changed on various roads through the area.